
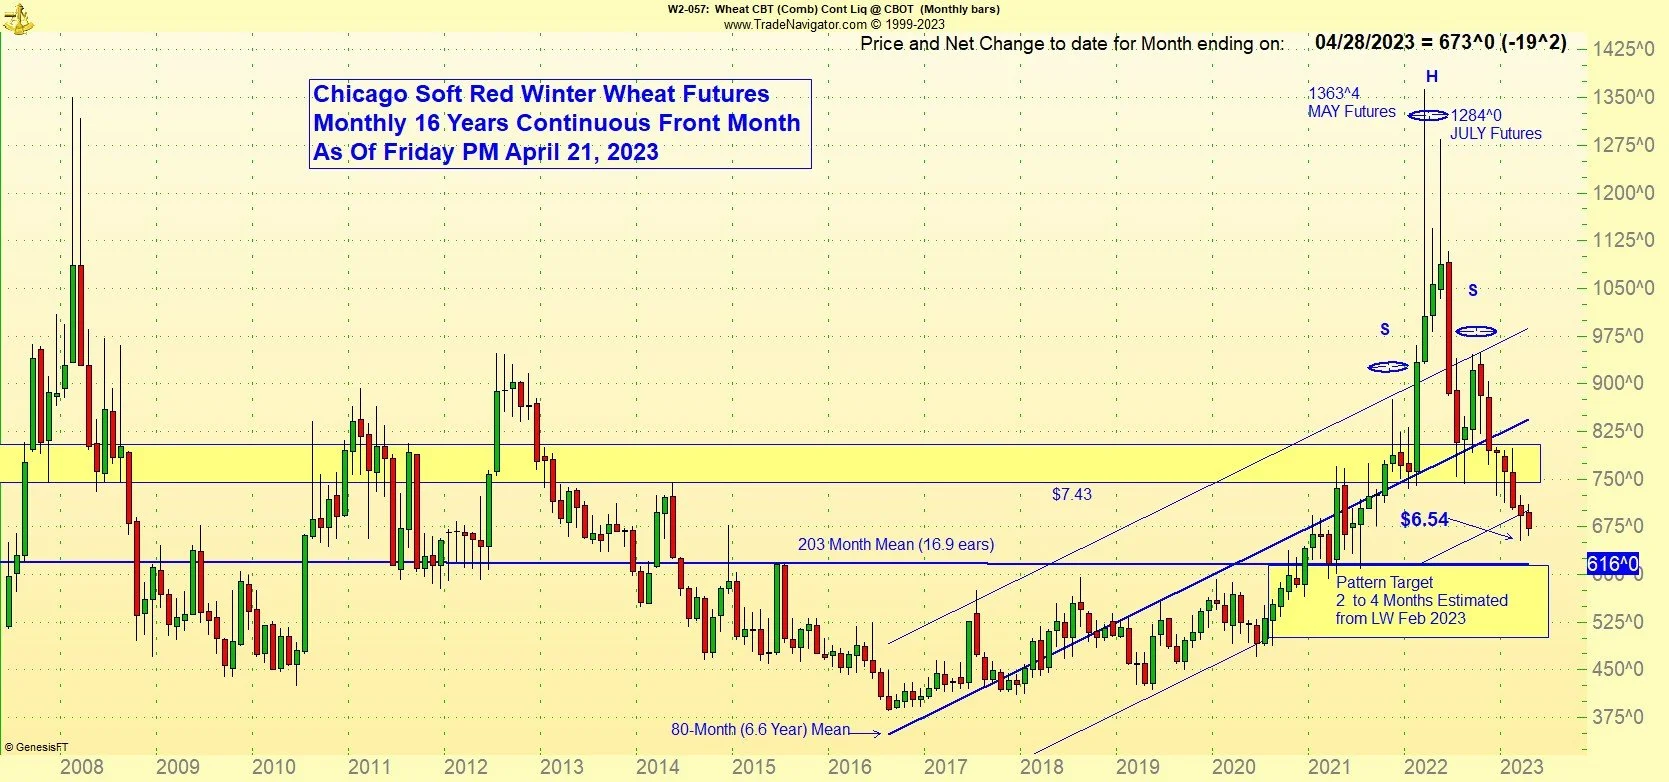
The long-term perspective on Chicago wheat prices produced an 18-month-wide “head-and-shoulders” pattern that has indicated lower prices ahead since the January ‘23 break downward through the $7.43 “Neckline”. At this point, now 70 cents below that break, the current Chicago contract (May) is within less than 60 cents from the threshold of the classical head and shoulders pattern target zone (in yellow). For a long-term chart, the move down has traveled unusually rapidly toward the downside projection, but this is not easily traded, as it is part of a long-term picture. Long-term chart patterns and trendlines are subject to very wide short-term price swings, and are best used as a background for market planning only.
The leading contract of Chicago (now May’23)* is trading well below a long-term defined area of price sensitivity (support/resistance). The technicals now portray a downward flow. The first test was $7.43, the low side of the range established as long-term support. That price zone (the “neckline”) is broken as $7.43 has significantly failed. There is little historical support, leaving a broad measure for a multi-year downtrend, with a current low target range of $6.14 to $5.00. This target is not hard-wired, but until a low is defined, the influence is negative.
* A “Front-month” futures chart always shows the leading contract in time. Each time the calendar approaches the expiration of any trading contract (the end of November for the December contract), the trade “rolls” any positions intended to be held beyond the currently expiring period to the next month (or farther) out. In the case of the now-mature December contract, the next month trading is March’23. This “roll-out” usually occurs about two weeks or so ahead of the “first notice day” for delivery of an expiring contract. There is no rule or set calendar day for this activity, but contract liquidity is essential, so most position managers will begin to shift contract months well before expiration. For U.S.-based futures, there are 5 annual contracts trading for each calendar year: March, May, July, September and December. Please use the “contact us” form or call for questions regarding market structure.
Using long-term monthly charts for short-term trading decisions is generally impractical, as the main setup, particularly the one at hand, is in years, not weeks, but this is when shorter time-frame charts may provide enough detail to take specific actions. A single market “event”, i.e. WASDE Report, or Russian action in Ukraine, could trigger a significant break outside of the recent range in either direction, to set the tone for the next chapter, but the emergence of the trigger event itself may take a proportional time to show up.
Long-term charts and Fibonacci ratios can be entertaining, but are rarely compelling. The above 15-year monthly chart does has some merit as a large-scale measuring stick. There are always retracements, sometimes years apart from the move that set them up, so using them for trading or marketing decisions in real-time can be extremely demanding of both capital and patience. In the current market, there is a timeframe of 6-7 months for the “Russian-Invasion-Move of 22”. The original upward trajectory of the wheat price from the 2016 lows has not been broken, but has been retraced (see reversion to the 72-month geometric mean) and may still be the “right” trajectory for the market post-invasion. Even the most dramatic price moves in the past have produced retracements in rough proportion to themselves. We are at a testing point. More attention will be focused on this perspective in coming weeks. For the moment, it seems prudent to continue marketing plans as before with an assumption of an intact downward trend, but with an eye to capturing some of a relatively large (contra-trend) upward movement if it emerges.
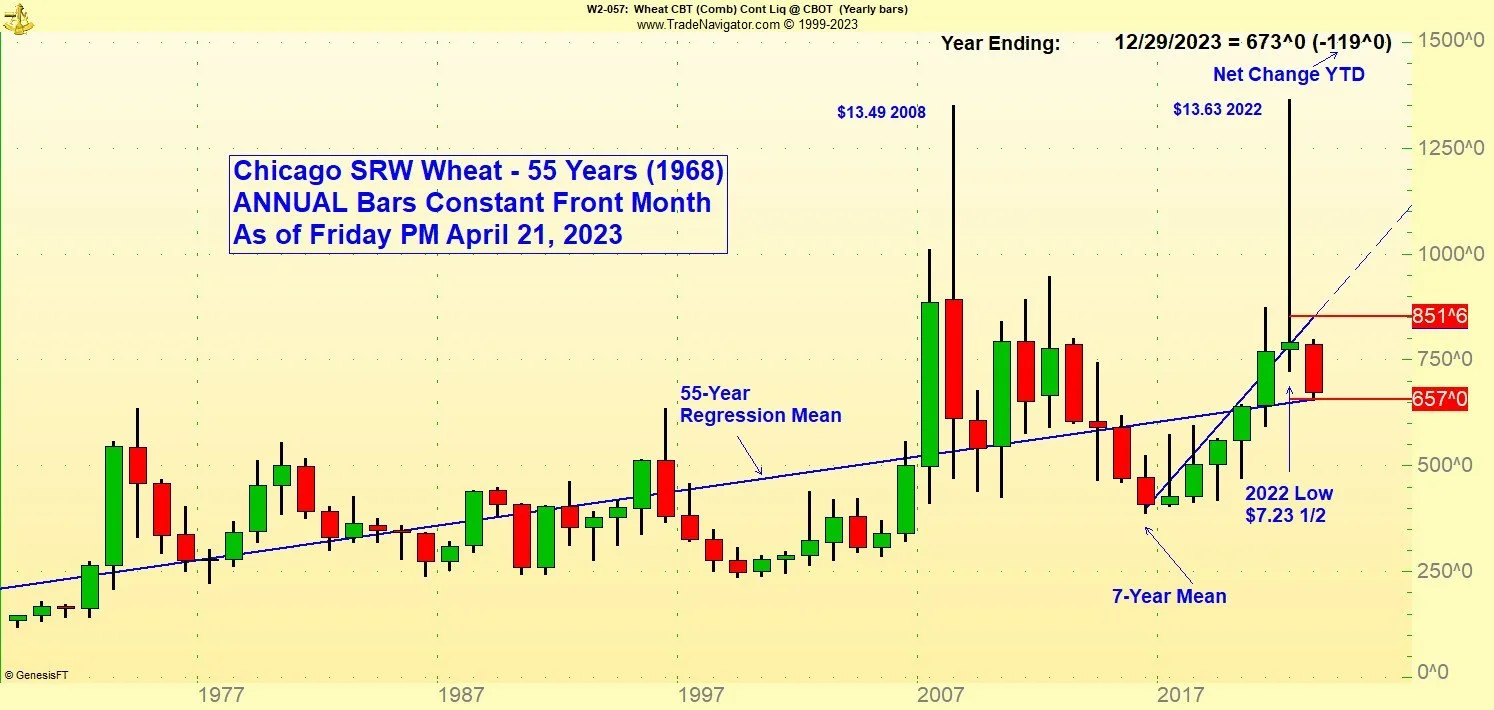
The net closing price change for the calendar year 2022 was PLUS 20 cents. Year to date ‘23 is now minus $1.19.
The high/low range was $6.28 per bushel for the year 2022 in Chicago lead futures.
As of the closing settlement in Chicago wheat on Friday, April 21, the current price is approximately $6.73, about $6.90 per bushel below the highest point of the last 12 months and 50 cents below the low of 2022. The still deteriorating trendline remains mildly upward in this very long timeframe, with the price moving toward, and now only 16 cents above the 55-year geometric mean. It will not reflect any tradeable, operationally practical change in trend until long after most trading opportunities to sell or exit are past. For now, this serves as a reminder that the trend is positive, but with a very high likelihood of “reversions” to the mean(s). Short-term decisions using such a long-term chart are not appropriate. It serves only the purpose of providing a background to shorter-term work.
The largest volatility factors for wheat prices are geo-political economics, If it were not for the shadow of a megalomaniacal Russian escapee from the Cold War of the 60’s, we would be seeing the global wheat markets dominated by massive Russian/Ukrainian crops, something we should prepare to see in the future, no matter who is in charge of Black Sea ports.
The state of anxiety remains high among many governments of both importing and exporting countries, although the specter of “Food Protectionism”, in which many governments slowed or halted wheat and other ag food exports, has receded into the background. Net importing countries are attempting to secure supplies of wheat even if that means buying from Vladimir Putin in a “private” or closed buying session instead of open tenders in which prices, origins and amounts are kept secret. The deal to allow Ukraine to ship grains out of Black Sea ports is under review. Putin has indicated that he is not interested in extending the program unless he benefits in some way, apparently mostly an easing of the sanctions hampering his own exports of grains and fertilizer. Russia has a giant crop for sale, and sales have been slow due to banking, insurance and shipping restrictions.
Chart studies, seasonal cycles, ratio measurements and other “technical” tools are useful in such markets, but most are best used to measure, test and confirm trend dimensions and are less often appropriate as hard trade signals. We will develop more detail on this approach in this space. We value your perspective. Please send us your thoughts on this matter via the “contact us” button in the top menu for this site.
MarketBullets® commonly uses “candlestick” charting. Each vertical candle represents one, three-month calendar quarter, with red for negative periods and green for positive. For each green candle, the first (opening) price traded for the period is the bottom of the colored part of the bar, while the final price traded is at the top. The opposite is true for red candles, with the opening price at the top and closing at the bottom. The black lines extending from the top and/or bottom of any candle represent prices traded at times between the opening and closing prices. The style is known as a “Candlestick” chart and makes an easy and intuitive visual presentation for price movement charts and can be expressed in any time period from minutes per candle to years or more.
Base (non-annotated) Charts Courtesy of Genesis Trade Navigator.